tnt
Choi et al. (2015) Nat. Biotech reanalysis: transposable elements
Sam Buckberry 29/06/2020
source("R/project_functions.R")
## Loading required package: BiocGenerics

##
## Attaching package: 'BiocGenerics'

## The following objects are masked from 'package:stats':
##
##     IQR, mad, sd, var, xtabs

## The following objects are masked from 'package:base':
##
##     anyDuplicated, append, as.data.frame, basename, cbind, colnames,
##     dirname, do.call, duplicated, eval, evalq, Filter, Find, get, grep,
##     grepl, intersect, is.unsorted, lapply, Map, mapply, match, mget,
##     order, paste, pmax, pmax.int, pmin, pmin.int, Position, rank,
##     rbind, Reduce, rownames, sapply, setdiff, sort, table, tapply,
##     union, unique, unsplit, which.max, which.min

## Welcome to Bioconductor
##
##     Vignettes contain introductory material; view with
##     'browseVignettes()'. To cite Bioconductor, see
##     'citation("Biobase")', and for packages 'citation("pkgname")'.

## Loading required package: ggplot2

## Loading required package: lattice

## Loading required package: GenomicRanges

## Loading required package: stats4

## Loading required package: S4Vectors

##
## Attaching package: 'S4Vectors'

## The following objects are masked from 'package:base':
##
##     expand.grid, I, unname

## Loading required package: IRanges

## Loading required package: GenomeInfoDb

## Loading required package: SummarizedExperiment

## Loading required package: MatrixGenerics

## Loading required package: matrixStats

##
## Attaching package: 'matrixStats'

## The following objects are masked from 'package:Biobase':
##
##     anyMissing, rowMedians

##
## Attaching package: 'MatrixGenerics'

## The following objects are masked from 'package:matrixStats':
##
##     colAlls, colAnyNAs, colAnys, colAvgsPerRowSet, colCollapse,
##     colCounts, colCummaxs, colCummins, colCumprods, colCumsums,
##     colDiffs, colIQRDiffs, colIQRs, colLogSumExps, colMadDiffs,
##     colMads, colMaxs, colMeans2, colMedians, colMins, colOrderStats,
##     colProds, colQuantiles, colRanges, colRanks, colSdDiffs, colSds,
##     colSums2, colTabulates, colVarDiffs, colVars, colWeightedMads,
##     colWeightedMeans, colWeightedMedians, colWeightedSds,
##     colWeightedVars, rowAlls, rowAnyNAs, rowAnys, rowAvgsPerColSet,
##     rowCollapse, rowCounts, rowCummaxs, rowCummins, rowCumprods,
##     rowCumsums, rowDiffs, rowIQRDiffs, rowIQRs, rowLogSumExps,
##     rowMadDiffs, rowMads, rowMaxs, rowMeans2, rowMedians, rowMins,
##     rowOrderStats, rowProds, rowQuantiles, rowRanges, rowRanks,
##     rowSdDiffs, rowSds, rowSums2, rowTabulates, rowVarDiffs, rowVars,
##     rowWeightedMads, rowWeightedMeans, rowWeightedMedians,
##     rowWeightedSds, rowWeightedVars

## The following object is masked from 'package:Biobase':
##
##     rowMedians

##
## Attaching package: 'magrittr'

## The following object is masked from 'package:GenomicRanges':
##
##     subtract

##
## Attaching package: 'data.table'

## The following object is masked from 'package:SummarizedExperiment':
##
##     shift

## The following object is masked from 'package:GenomicRanges':
##
##     shift

## The following object is masked from 'package:IRanges':
##
##     shift

## The following objects are masked from 'package:S4Vectors':
##
##     first, second

## Loading required package: BSgenome

## Loading required package: Biostrings

## Loading required package: XVector

##
## Attaching package: 'Biostrings'

## The following object is masked from 'package:base':
##
##     strsplit

## Loading required package: rtracklayer

## Loading required package: AnnotationDbi

##
## Attaching package: 'ggthemes'

## The following object is masked from 'package:cowplot':
##
##     theme_map

## Loading required package: Rsamtools

##
## Attaching package: 'VariantAnnotation'

## The following object is masked from 'package:stringr':
##
##     fixed

## The following object is masked from 'package:base':
##
##     tabulate

##
## Attaching package: 'ChIPpeakAnno'

## The following object is masked from 'package:VariantAnnotation':
##
##     info

##
## Attaching package: 'gtools'

## The following object is masked from 'package:e1071':
##
##     permutations

##
## Attaching package: 'UpSetR'

## The following object is masked from 'package:lattice':
##
##     histogram

## Loading required package: limma

##
## Attaching package: 'limma'

## The following object is masked from 'package:BiocGenerics':
##
##     plotMA

## Loading required package: grid

##
## Attaching package: 'grid'

## The following object is masked from 'package:Biostrings':
##
##     pattern
TE quantification (not run)
parallel -j 35 ~/working_data_01/bin/TElocal/TElocal -b {} \
--GTF /home/sbuckberry/working_data_02/polo_project/human_ips/resources/hg19_ensGene_with_ercc.gtf \
--TE /home/sbuckberry/working_data_02/polo_project/human_ips/resources/hg19_rmsk_TElocus.ind \
--project {.} \
--format BAM \
--sortByPos \
--stranded reverse \
--mode uniq ::: SRS*uniq.bam
Read the sample count tables and combine into matrix
# # List the counts tables for all samples
# cnt_files <- list.files(path = "RNAseq/hochedlinger_data/te_analysis/", full.names = TRUE, pattern = "cntTable.gz")
#
# dat2 <- lapply(cnt_files, read.table, header = TRUE, row.names = 1) %>% do.call(cbind, .)
# libs <- colnames(dat2) %>% str_sub(start = 1, end = 10)
# colnames(dat2) <- libs
#
# #remove rows with all zero's
# keep_row <- rowSums(dat2) > 0
# table(keep_row)
# dat2 <- dat2[keep_row, ]
# saveRDS(dat2, file = "RNAseq/hochedlinger_data/all_te_and_gene_counts.Rds")

dat2 <- readRDS("RNAseq/hochedlinger_data/all_te_and_gene_counts.Rds")
dim(dat2)
## [1] 2048776 63
Read the meta-data table and match to expression data
sample_dat <- fread("RNAseq/hochedlinger_data/sample_sheet.csv")
sample_dat <- sample_dat[match(colnames(dat2), sample_dat$secondary_sample_accession), ]
all(colnames(dat2) == sample_dat$Run)
## [1] TRUE
Read in the count data
y2 <- DGEList(counts = dat2)
y2$samples <- cbind(y2$samples, sample_dat)
Load the transposable element data
## Get the TE genome co-ordinates
 repeat_gtf <- read.table("resources/hg19_rmsk_TE.gtf.gz")
 repeat_gr <- GRanges(seqnames = repeat_gtf$V1,
                      ranges = IRanges(start = repeat_gtf$V4,
                                       end = repeat_gtf$V5))
 strand(repeat_gr) <- repeat_gtf$V7
 repeat_gr$class <- repeat_gtf$V19
 repeat_gr$family <- repeat_gtf$V16
 repeat_gr$gene <- repeat_gtf$V10
 repeat_gr$transcript <- repeat_gtf$V13
 repeat_gr$id <- str_c(repeat_gr$transcript, repeat_gr$family, repeat_gr$class, sep = ":")
 rm(repeat_gtf)
 saveRDS(repeat_gr, "resources/hg19_rmsk_TE_granges.Rds")

repeat_gr <- readRDS("resources/hg19_rmsk_TE_granges.Rds")
repeat_gr <- readRDS("resources/hg19_rmsk_TE_granges.Rds")
Function to test DE for each genetic background
test_te_de <- function(background="HUES3", groups=c("iPSC", "ESC_GFP"), dataset="data set: isogenic"){
y_sub <- y2[ ,(y2$samples$Background %in% background) &
(y2$samples$Group %in% groups) &
(y2$samples$characteristics_ch1 == dataset)]
dim(y_sub)
design <- model.matrix(~Group, data=y_sub$samples)
colnames(design) <- str_remove(string = colnames(design), pattern = "Group")
keep <- filterByExpr(y_sub, design)
table(keep)
y_sub <- y_sub[keep, ,keep.lib.sizes=FALSE]
y_sub <- calcNormFactors(y_sub)
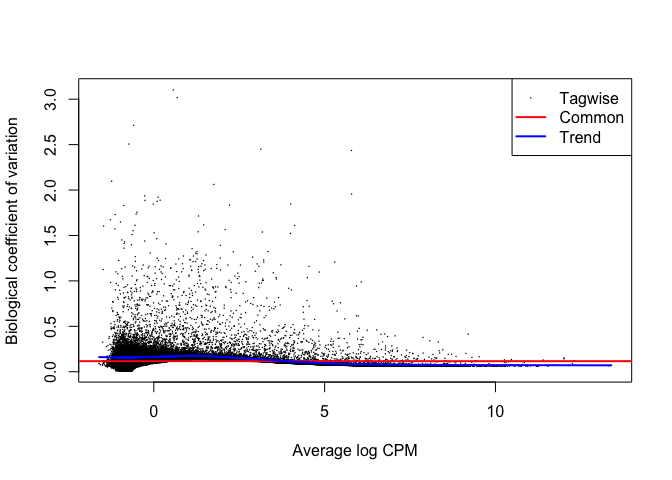
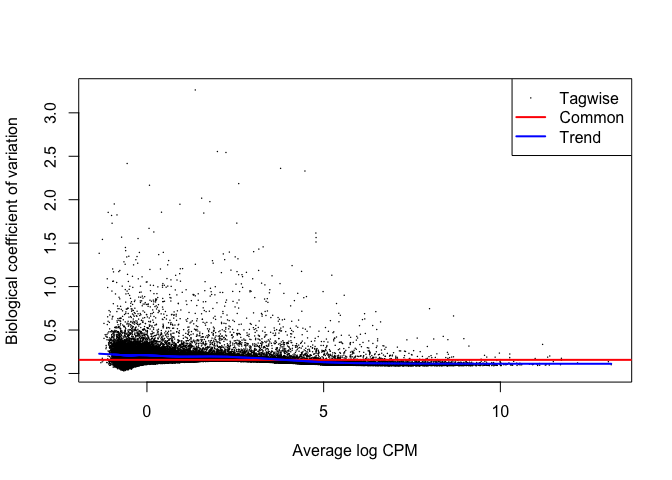
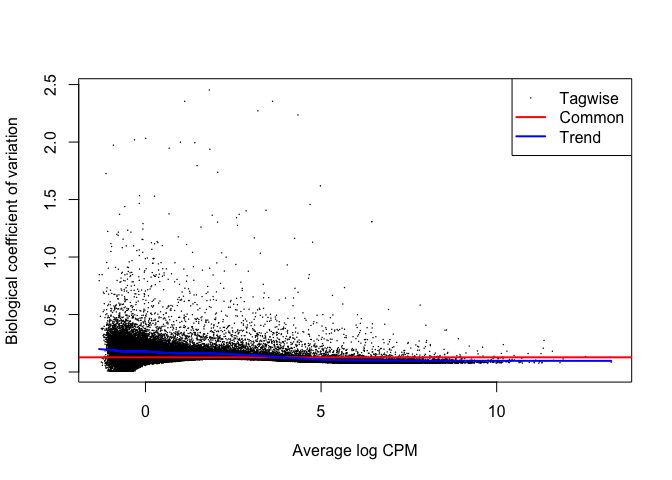
y_sub <- estimateDisp(y_sub, design = design, robust = TRUE)
plotBCV(y_sub)
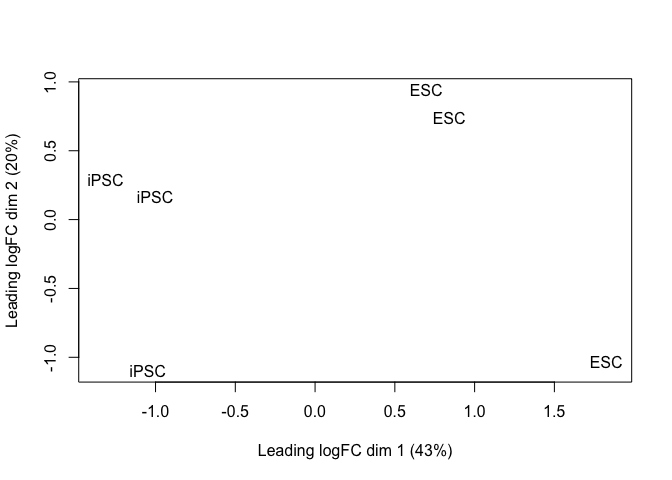
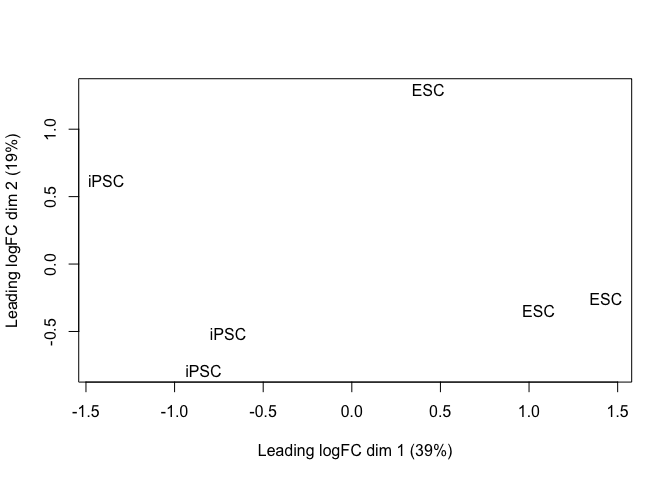
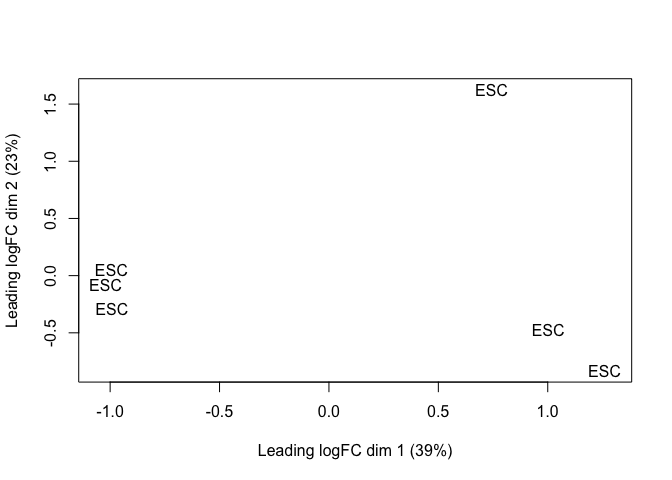
plotMDS(y_sub[grepl(pattern = "_dup", rownames(y_sub)), ], labels = y_sub$samples$source_name_ch1)
fit <- glmFit(y_sub, design)
lrt <- glmLRT(fit, contrast=c(0,-1))
tt <- topTags(lrt, n = nrow(y_sub))
tt_table <- tt$table
tt_table$gene_id <- rownames(tt_table)
tt_table$contrast <- background
# Subset for TE's and recalculate FDR
tt_table <- tt_table[tt_table$gene_id %in% repeat_gr$id, ]
tt_table$FDR <- p.adjust(p = tt_table$PValue, method = "fdr")
tt_table$significant <- (abs(tt_table$logFC) > 1) & (tt_table$FDR < 0.05) & (tt_table$logCPM > 0)
tt_table$significant <- ifelse(test = tt_table$significant, yes = "Significant", no = "NS")
tt_table$significant <- factor(tt_table$significant, levels = c("NS", "Significant"))
# Add the TE locus information
ind <- match(tt_table$gene_id, repeat_gr$id)
tt_table <- cbind(tt_table, as.data.frame(repeat_gr)[ind, ])
}
hues3_tt <- test_te_de(background = "HUES3")
hues2_tt <- test_te_de(background = "HUES2")
hues2_GFP_tt <- test_te_de(background = "HUES2", groups = c("ESC", "ESC_GFP"))
all_tt <- rbind(hues2_tt, hues3_tt)
te_de_df <- all_tt
sig_ids <- te_de_df$gene_id[te_de_df$significant == "Significant"] %>% unique()
background <- c("HUES2", "HUES3")
groups <- c("iPSC", "ESC_GFP")
dataset <- "data set: isogenic"
y_sub <- y2[ ,(y2$samples$Background %in% background) &
(y2$samples$Group %in% groups) &
(y2$samples$characteristics_ch1 == dataset)]
all_cpm <- log2(cpm(y_sub) + 1)
hm_annot_dat <- y_sub$samples[ ,c("Background", "Group")]
col_ids <- str_c(y_sub$samples$title)
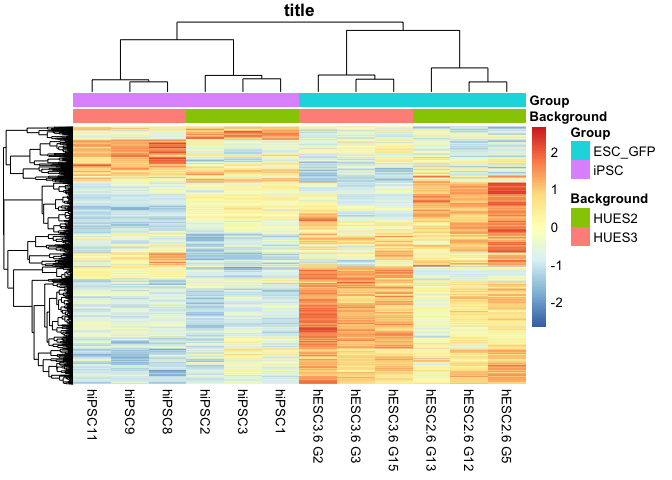
plot_dat <- all_cpm[rownames(all_cpm) %in% sig_ids, ]
#plot_dat <- all_cpm[grepl("HERVH-int", rownames(all_cpm)),
# y_sub$samples$source_name_ch1 != "Fibroblast"]
plot_dat <- plot_dat[complete.cases(plot_dat), ] %>% data.frame()
pdf("RNAseq/plots/Choi_TE_heatmap_combined.pdf", width = 4, height = 5)
pheatmap(plot_dat, scale = 'row',
annotation_col = hm_annot_dat,
labels_col = col_ids, main = "title",
annotation_names_col = TRUE,
show_rownames = FALSE, border_color = NA,
clustering_distance_rows = 'correlation',
clustering_distance_cols = 'correlation')
dev.off()
## pdf
##   3
pheatmap(plot_dat, scale = 'row',
         annotation_col = hm_annot_dat,
                 labels_col = col_ids, main = "title",
                 annotation_names_col = TRUE,
                 show_rownames = FALSE, border_color = NA,
                 clustering_distance_rows = 'correlation',
                 clustering_distance_cols = 'correlation')
wb_ed_fig8k <- openxlsx::createWorkbook()
openxlsx::addWorksheet(wb_ed_fig8k, sheetName = "ED_Fig_8k")
openxlsx::writeData(wb = wb_ed_fig8k, sheet = "ED_Fig_8k",
                    x = plot_dat)
openxlsx::saveWorkbook(wb = wb_ed_fig8k,
                       file = "ED_Figure_8k_source_data.xlsx", overwrite = TRUE)